.svg)
.svg)
Home - Blog
%20(1).png)
At New Incentives, being data-driven isn’t an option. It’s in our DNA. That’s why we collect high-quality, verifiable data to inform program decisions. We conduct vaccination coverage surveys, known internally as rapid assessments, to measure routine immunization coverage and health-seeking behavior across northern Nigeria. We follow rigorous sampling and post-survey verification procedures to obtain representative surveys that help us understand whether we are reaching the population we seek to serve.
In 2025, our team conducted over 26,000 household surveys (and screened more than 100,000 other households) across 13 states to gather representative data on indicators of program impact, including routine immunization coverage, uptake of oral rehydration solution (ORS), and diarrheal incidence. This scale of surveying enables us to answer operational and impact questions in near real time—such as making cost-effective expansion decisions or targeting low-performing LGAs—and it gives partners confidence that our data is robust and actionable.
A randomized controlled trial (RCT) conducted from 2017 to 2020 established that New Incentives' program increases vaccination uptake. The RCT found that our program doubled the proportion of children who are fully immunized, which is a substantial, positive impact that earned us recognition as one of GiveWell's top charities.
But programs tested in a pilot stage can behave differently once rolled out at large scale. Continuous coverage monitoring bridges the gap between initial results and ongoing real-world performance. It indicates whether the gains seen in trials are achieved and sustained at scale, where and when they are not, and how best to allocate resources to maximize lives saved.
Put simply, RCT results tell us a program can work at scale; monitoring helps us determine whether it actually does.
Many organizations conduct coverage surveys, but New Incentives goes to exceptional lengths to ensure our data is both representative and reliable. Several aspects of our approach stand out.
We Fight Sampling Bias at Every Turn
Obtaining a truly representative sample is more challenging than it may seem. If your sample skews toward urban areas or easily accessible households near roads or village centers, your results may not accurately reflect reality.
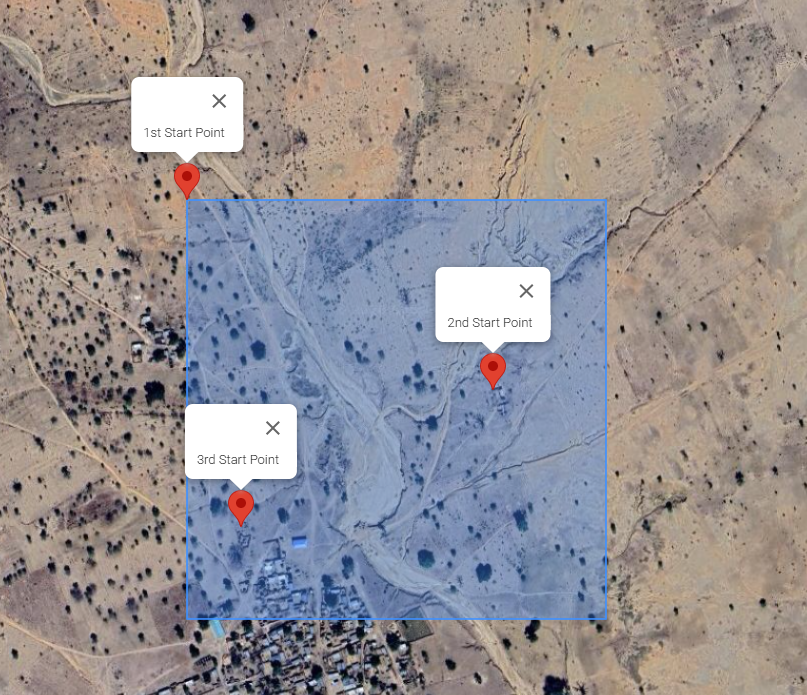
We’ve developed a rigorous approach to eliminate these biases, starting with how we define the geographic areas we survey. Instead of relying on arbitrary boundaries or convenience sampling, we draw a stratified random sample of enumeration areas (EAs) from the geographic area of the expansion group, proportional to population size. To do so, we follow these steps:

All of the boxes you see above are potential enumeration areas that may be randomly selected within each survey round.
LGAs are grouped into expansion cohorts. We conduct a baseline survey six months before expanding to a new cohort, with follow-ups on a regular schedule (typically the first follow-up around 12 months after baseline, and subsequent follow-ups every six to nine months). This ongoing data collection lets us track whether coverage gains hold over time, not just at a single point in time.
We Follow Strict Fieldwork Protocols to Minimize Bias
A representative sampling framework only works if enumerators follow protocols precisely in the field. Our fieldwork protocols are designed to prevent common biases such as convenience sampling, community-led selection, or informal heuristics and to ensure results reflect reality rather than the path of least resistance.
Within each selected grid cell, surveyors follow strict protocols. They begin at the northwestern corner of the enumeration area and move clockwise, identifying and screening structures systematically until they reach the target number of surveys. If they can't find enough eligible households in the selected area, they are instructed to move along the periphery rather than skip to more convenient locations. Our map and back checks (more below) are specifically designed to catch any deviations from this.
We also provide enumerators with a pre-specified second starting point (and sometimes a third in sparsely populated areas) in case the primary location has no man-made structures; if no houses are found in the enumeration area, it is replaced from a buffer list. Importantly, enumerators record all structures they encounter along the route (not only residences) and mark the status of each one. They do not ask community leaders to pick households or apply informal selection rules.
Within each household, enumerators identify eligible children (ages 0–59 months). The routine immunization part of the survey is administered only to 6- to 12-month-old children, and the diarrhea and ORS portion can be administered to those children or their siblings. If multiple eligible children are present, one is selected at random through programmed randomization in the app. This avoids enumerator selection bias. We also take non-identifying photos of each household entrance to confirm we haven’t surveyed the same household twice.
The information we gather is sensitive, including names, health records, physical location, and other personal data. We collect consent via a physical form for each household and attach a photo of that signed form to the screening and survey data entry in our secure app. Caregivers can always refuse to participate; in that case, their refusal is documented, and the survey moves on to the next house. All data collected is accessible only to key team members who need it.
In each survey, enumerators collect self-reported vaccination histories from caregivers and, where available, seek objective verification, including photographing child health cards (stored securely) and conducting BCG scar checks. We also gather contextual data: household demographics, caregiver motivations, and, where relevant, diarrhea incidence and ORS and zinc usage. All data is collected electronically, encrypted, and uploaded to secure servers so our teams can monitor progress and flag anomalies quickly.
Representative sampling is only valuable if the data collected is accurate. At New Incentives, we have a dedicated team of enumerators who conduct our coverage surveys. Each enumerator underwent extensive training, and we’ve implemented multiple layers of quality checks, each designed to catch different types of errors or bias.
Map Checks confirm that the enumerator made it to the assigned enumeration area, started in the northwest corner, followed the established survey pattern, and didn’t skip structures. Detailed GPS data is reviewed for every survey day to ensure the protocol was followed.
.png)
Back Checks serve two main purposes: to determine whether the enumerator missed houses and whether the enumerator recorded answers accurately. During a back check, the surveyor follows the same survey pattern and visits the same households. The surveyor then re-asks a subset of survey questions to determine whether the answers correspond. A significant portion of survey days are randomly assigned a back check.
Audio Checks involve recording and reviewing each survey to ensure questions are asked correctly and answers are recorded accurately by the enumerator. Monitoring & Evaluation (M&E) Managers, M&E Officers, and dedicated reviewers verify whether the information entered matches what was actually said in the recordings, catching both innocent transcription errors and intentional data falsification. The audio assignment review process is randomized.
These checks occur in batches, groups of approximately eight nearby enumeration areas assigned to the same enumerator. For a batch to pass, at least 75 percent of back checks, map checks, and audio checks must pass. If a batch fails this threshold, we exclude the entire batch (not just the bad data) and conduct new surveys, applying the same quality checks. Only batches meeting our quality criteria are used for primary analysis. We also analyze batches that did not meet quality criteria to identify whether there are systematic differences in primary outcomes.
Beyond these routine checks, our M&E Officers conduct unannounced, random audit back-checks to assess whether enumerators followed protocols during surveys and back-checks, investigate anomalies or performance concerns, and detect any collusion or falsification. When misconduct is found, remedial actions range from retraining to termination.
Security assessments at the ward level (rated Low, Medium, High, or No-Go) ensure enumerator safety. We do not schedule surveys in wards designated as No-Go for the round, and we cancel planned days if the security rating changes. The security assessment is conducted by a dedicated security team before each cohort begins in order to determine whether any wards are unsafe for surveying.
We don’t treat our monitoring protocol as fixed. As we scale, learn more, and receive feedback, we continuously refine our approach.
For example, we recently changed the starting point location for back checks based on feedback we received. When an enumerator navigates to their enumeration area, they have at least two GPS locations: the northwest corner of the 0.5 km × 0.5 km grid and the first house we can manually find on Google satellite imagery. Previously, if the enumerator started at the second starting point, that’s where the second surveyor went for back check. We’ve now updated the protocol so the surveyor conducting the back check always navigates to the first starting point and verifies that no houses were skipped because they were missing from the satellite imagery.
In addition to submitting GPS coordinates for each structure, enumerators now also mark whether a building is residential, as this is something we can’t determine from satellite imagery alone. This means we’ll have a better understanding of the percentage of households we’re able to speak to and the percentage we had to skip.
We hold ourselves to this high standard of rigor because undetected data quality issues could lead to incorrect operational decisions that reduce our cost-effectiveness or the quality of our programming. Our commitment to gathering and using high-quality data ensures that every dollar donated to New Incentives has the maximum possible impact on childhood health.
Get the latest blogs and program updates sent to your inbox. We send emails sparingly.


Follow us on social media to stay up to date on our rapid growth.

.png)

.png)